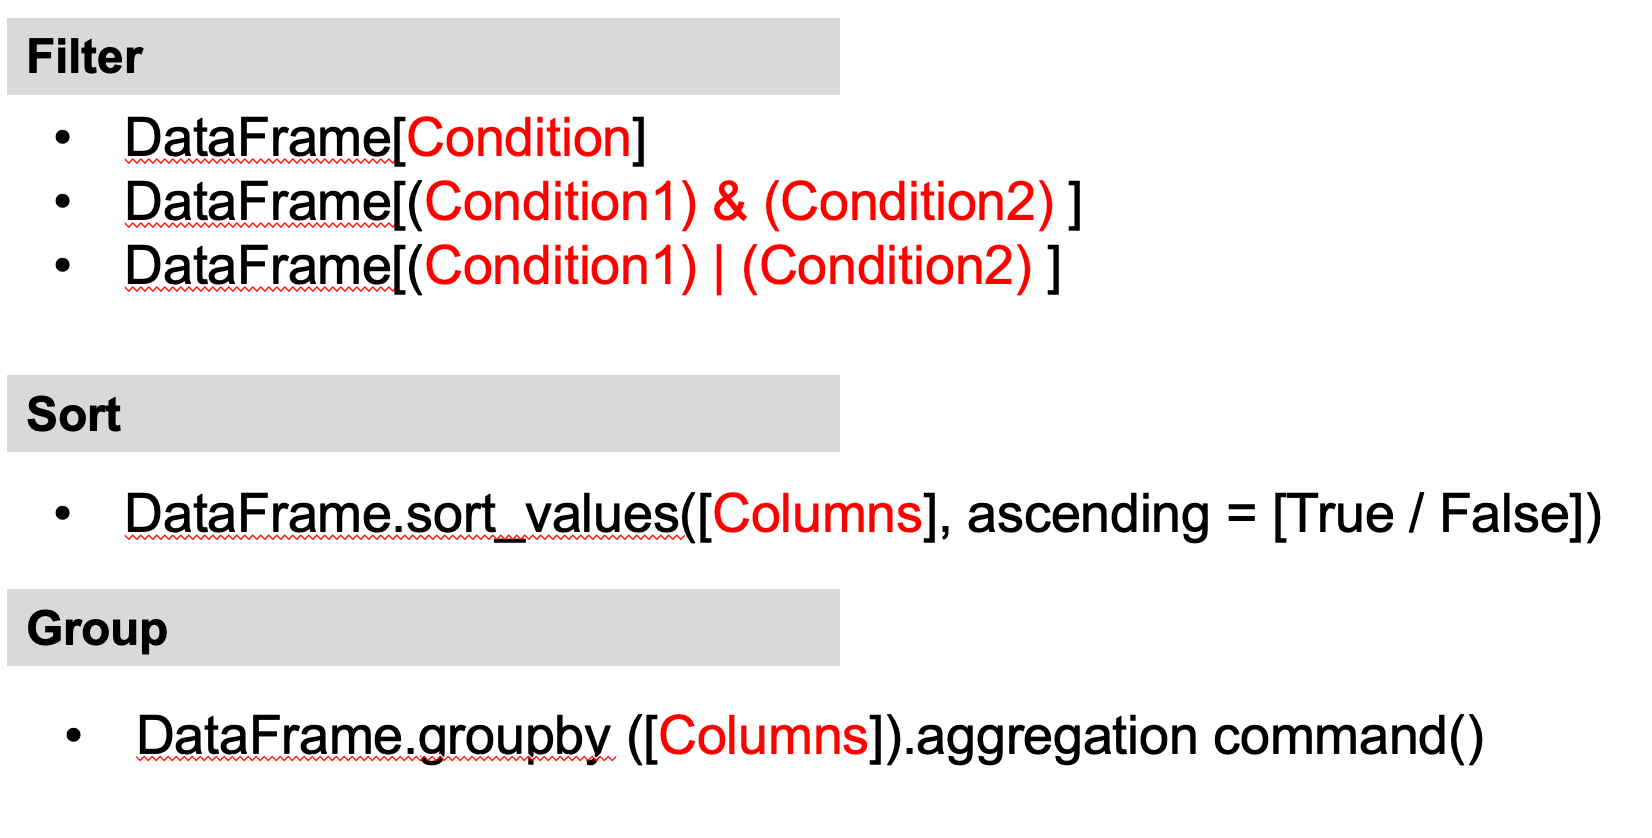
Slice data using simple conditions
You can also slice data using conditions based on the value of one or more columns.
The structure of the command line is: DataFrame[Condition]
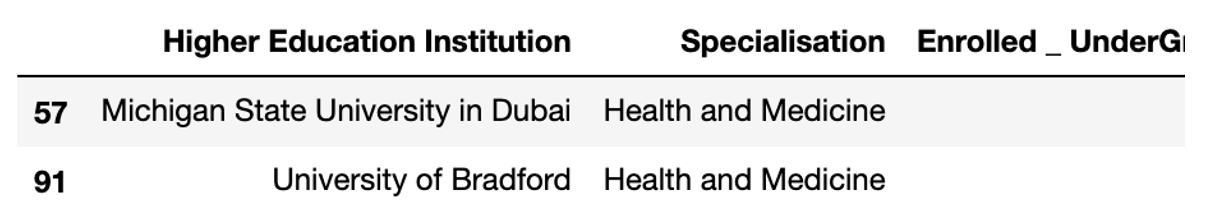
Example 1: Display all the rows where "Specialisation" is "Health and Medicine"
Condition: data["Specialisation"] == "Health and Medicine" the code is:data[data["Specialisation"] == "Health and Medicine"]
Another Slice data using simple conditions
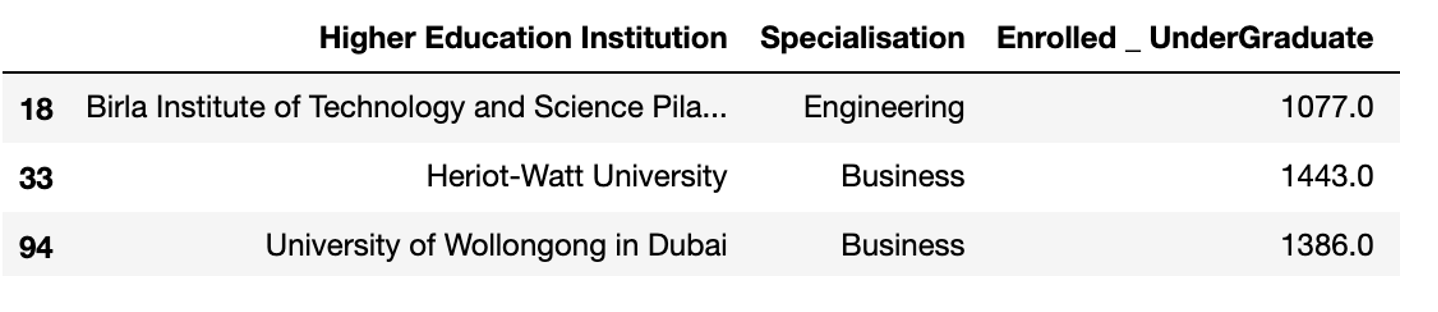
Example 2: Display all the rows where "Enrolled _ UnderGraduate" is 1000 and above
data[data["Enrolled _ UnderGraduate"] >= 1000]
Example 3: Display total number of rows where "Enrolled _ UnderGraduate" is greater or equal to the average "Enrolled _ UnderGraduate"
data[data["Enrolled _ UnderGraduate"] >= data["Enrolled _ UnderGraduate"].mean()]

Slice data using multiple conditions
To slice data using more than one condition, you need to put each condition inside a bracket ( ). You also need to use a logical operator. The symbol & is used for and. The symbol | is used for or.
The structure of the command line is:
- DataFrame[(Condition) & (Condition)]
- DataFrame[(Condition) | (Condition)]
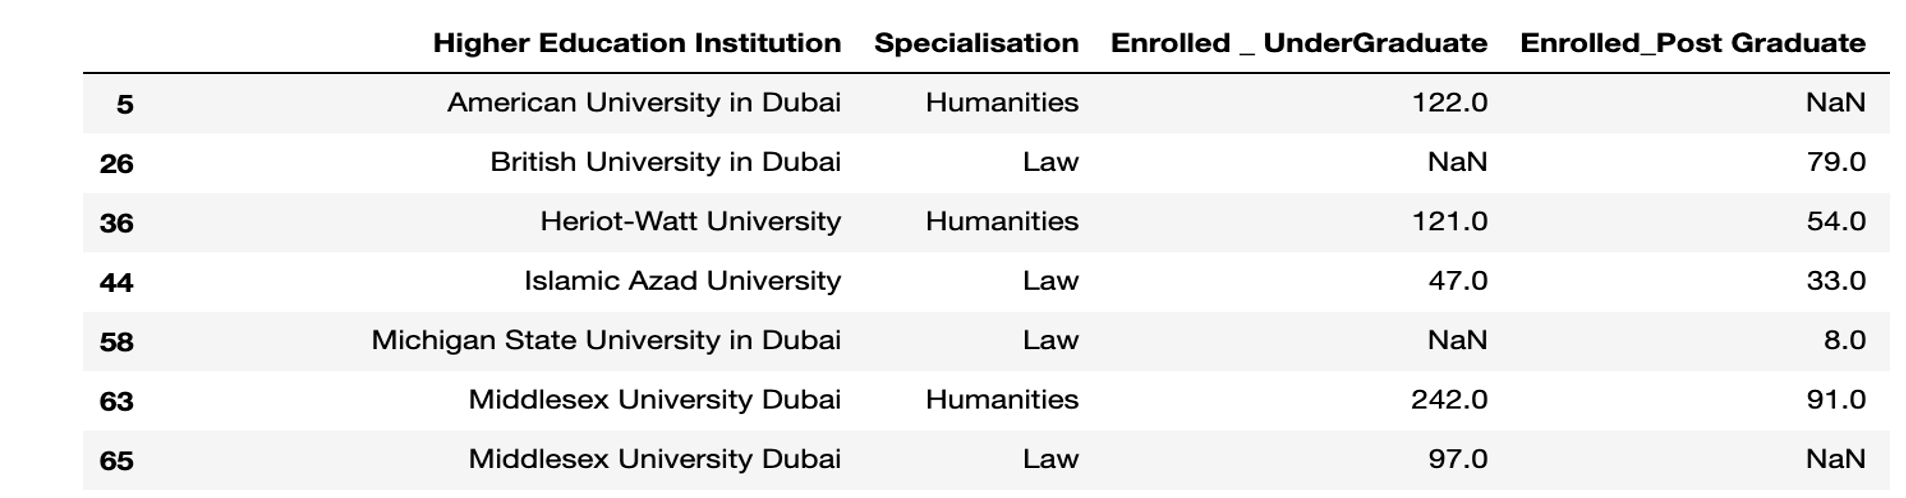
Example 4: Display all the rows where "Specialisation" is "Law" or "Humanities"
(data["Specialisation"] == "Law") | (data["Specialisation"] == "Humanities")
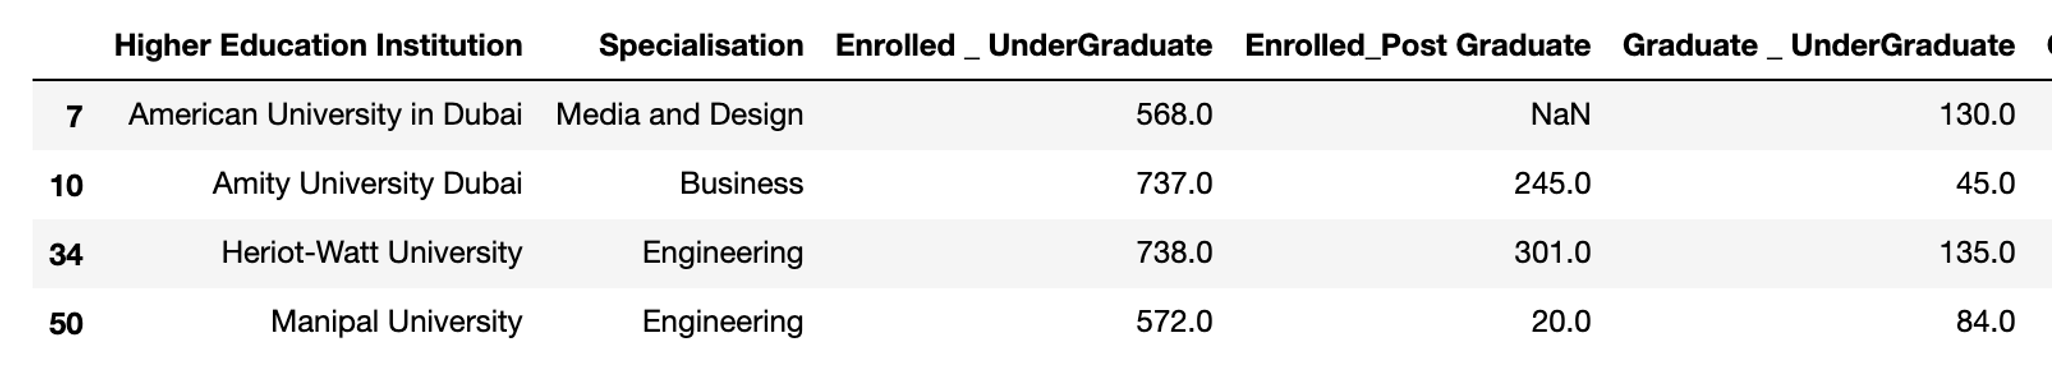
Example 5: Display all the rows where " Enrolled _ UnderGraduate" value is from 500 to 800
(data["Enrolled _ UnderGraduate"] ≥ 500) & (data["Enrolled _ UnderGraduate" ≤ 800)
Sorting data with one column
Sorting data is a technique that display data in an ascending or descending order.
data.sort_values(['CoulmnName'], ascending=False)
By default, the data will be sorted in ascending order.
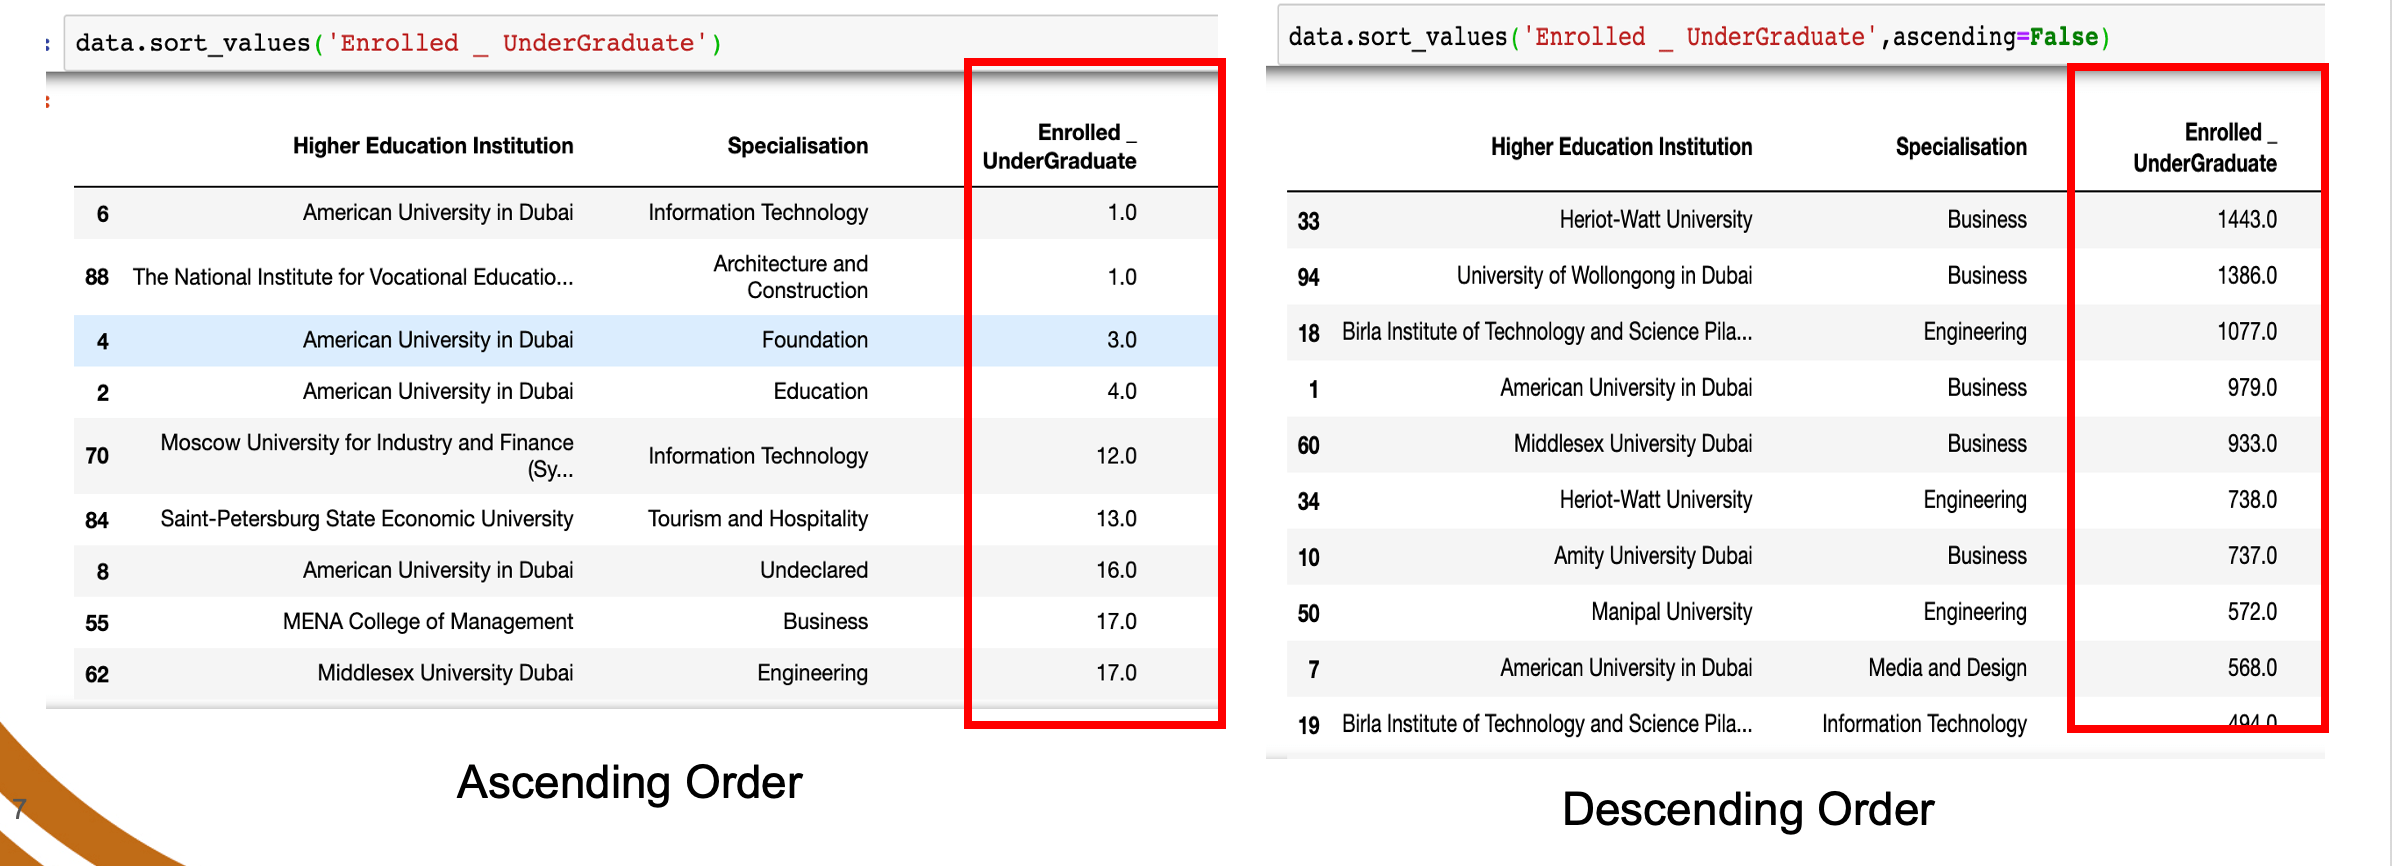
Example: Sort the Enrolled _ UnderGraduate column
data.sort_values('Enrolled _ UnderGraduate')
data.sort_values('Enrolled _ UnderGraduate', ascending = False)
Sorting data with more than one column
To sort data based on more than one column, you need to include all columns inside the square bracket.
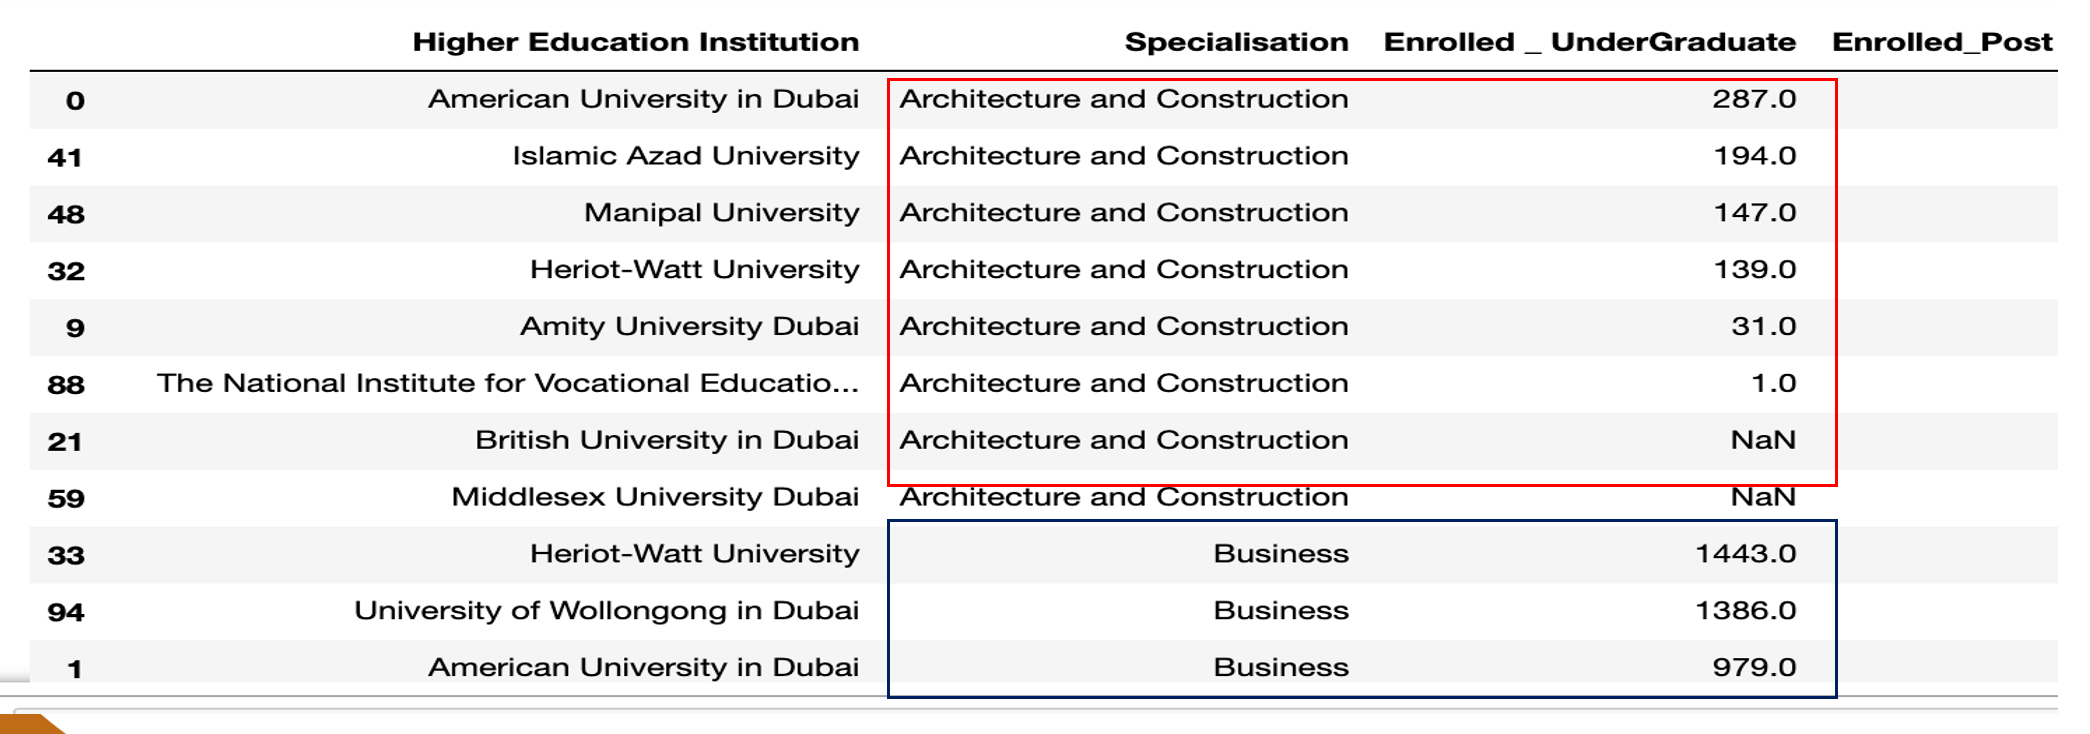
Example: Sort Specialisation in ascending order, Enrolled undergraduate in descending order
data.sort_values(['Specialisation','Enrolled _ UnderGraduate'],ascending=[True,False])
Grouping Data
Grouping data by columns is used when you have duplicated data in a particular column. For example you, the same student is doing more than one course and has grades in each course. The function needed for this operation is .groupby
dataframe.groupby(['Column1', 'Column2']).mean()
Instead of mean(), you can use sum(), min() or any of the aggregation commands.
Example: Display the total Number of students enrolled in each specialisation
data.groupby('Specialization') [ ['Total Enrolled']].sum()

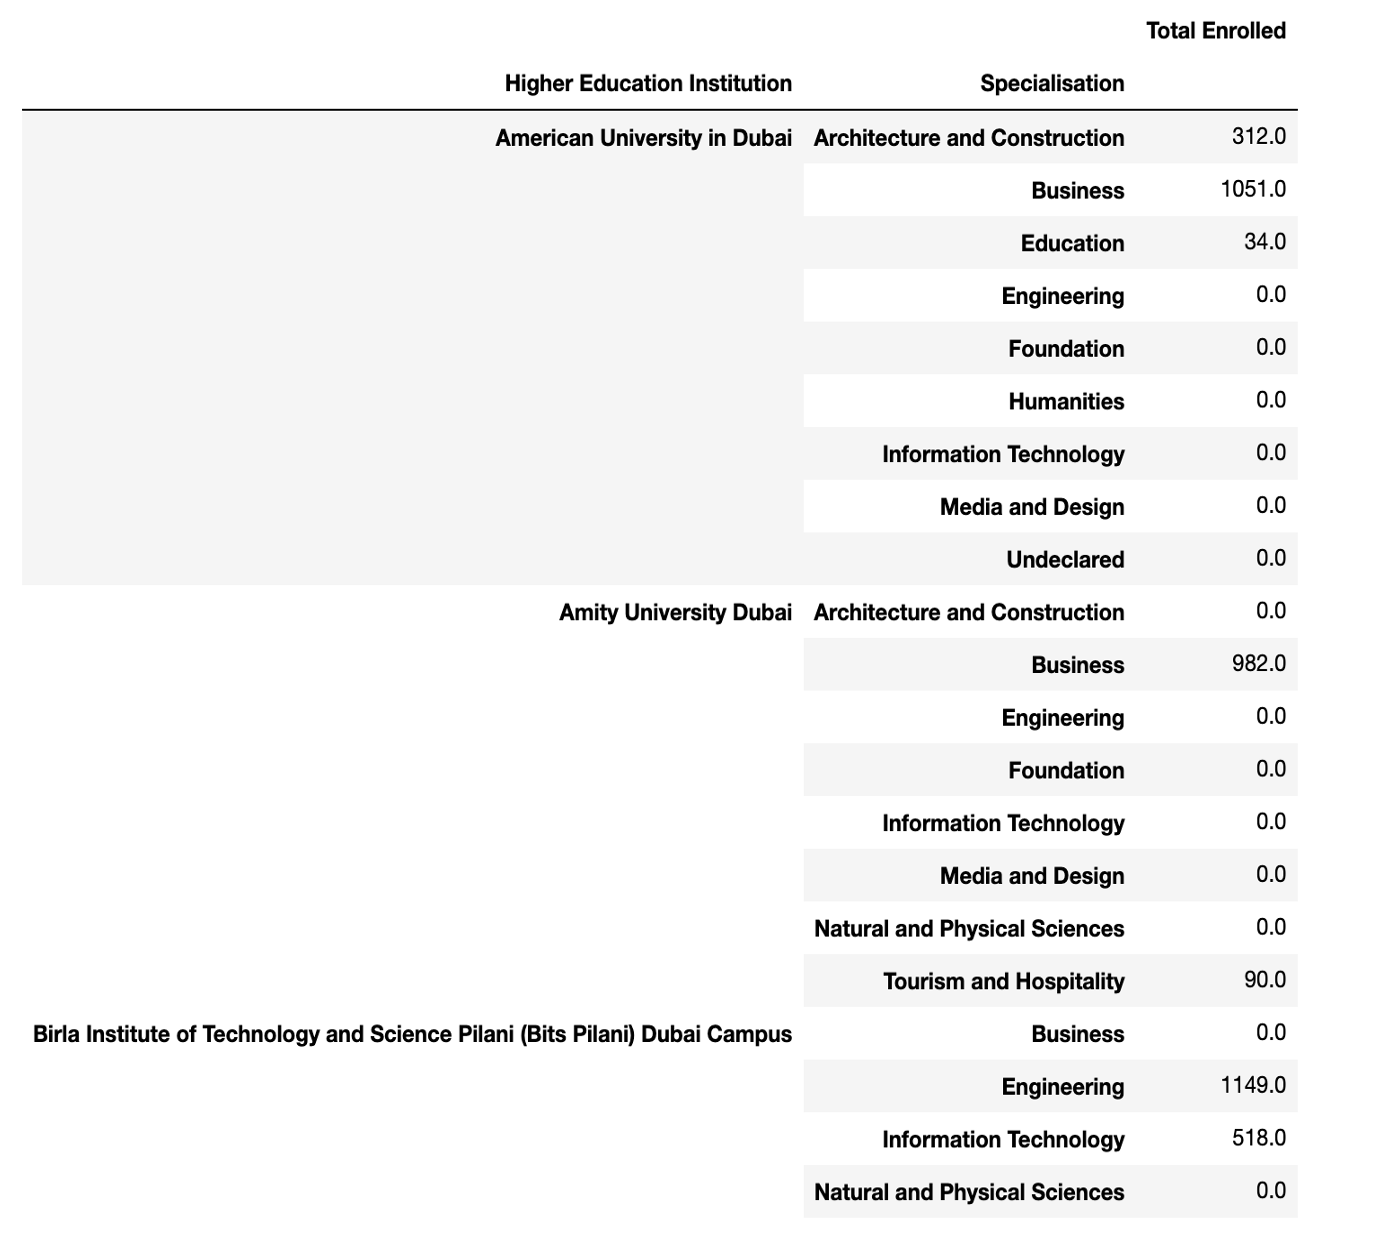
Example 2: Total Number of students enrolled in each specialisation, by each Institution
data.groupby(['Higher Education Institution', 'Specialization')] [ ['Total Enrolled']].sum()
Summary of Pandas Commands