Exercise with Solution
Exercise 2:
The value of many of the things we buy depreciates (decreases) with time.If you buy a car for $80,000, its value after one year will be less than this.
Suppose you think that the value will depreciate at the rate of $10,000 per year.
After one year, the value will be $70,000. After two years, the value will be $60,000.
After x years the value will be 80000 − 10000x dollars.
So if y is the value of the car after x years, then y = 80000 − 10000x
This equation is a model for the situation.
Solution:
We draw an accurate graph of this equation for x = 0 to x = 8 using the horizontal axis for x and the vertical axis for y.
| x | 0 | 2> | 4 | 6 | 8 |
| y | 80000 | 60000 | 40000 | 20000 | 0 |
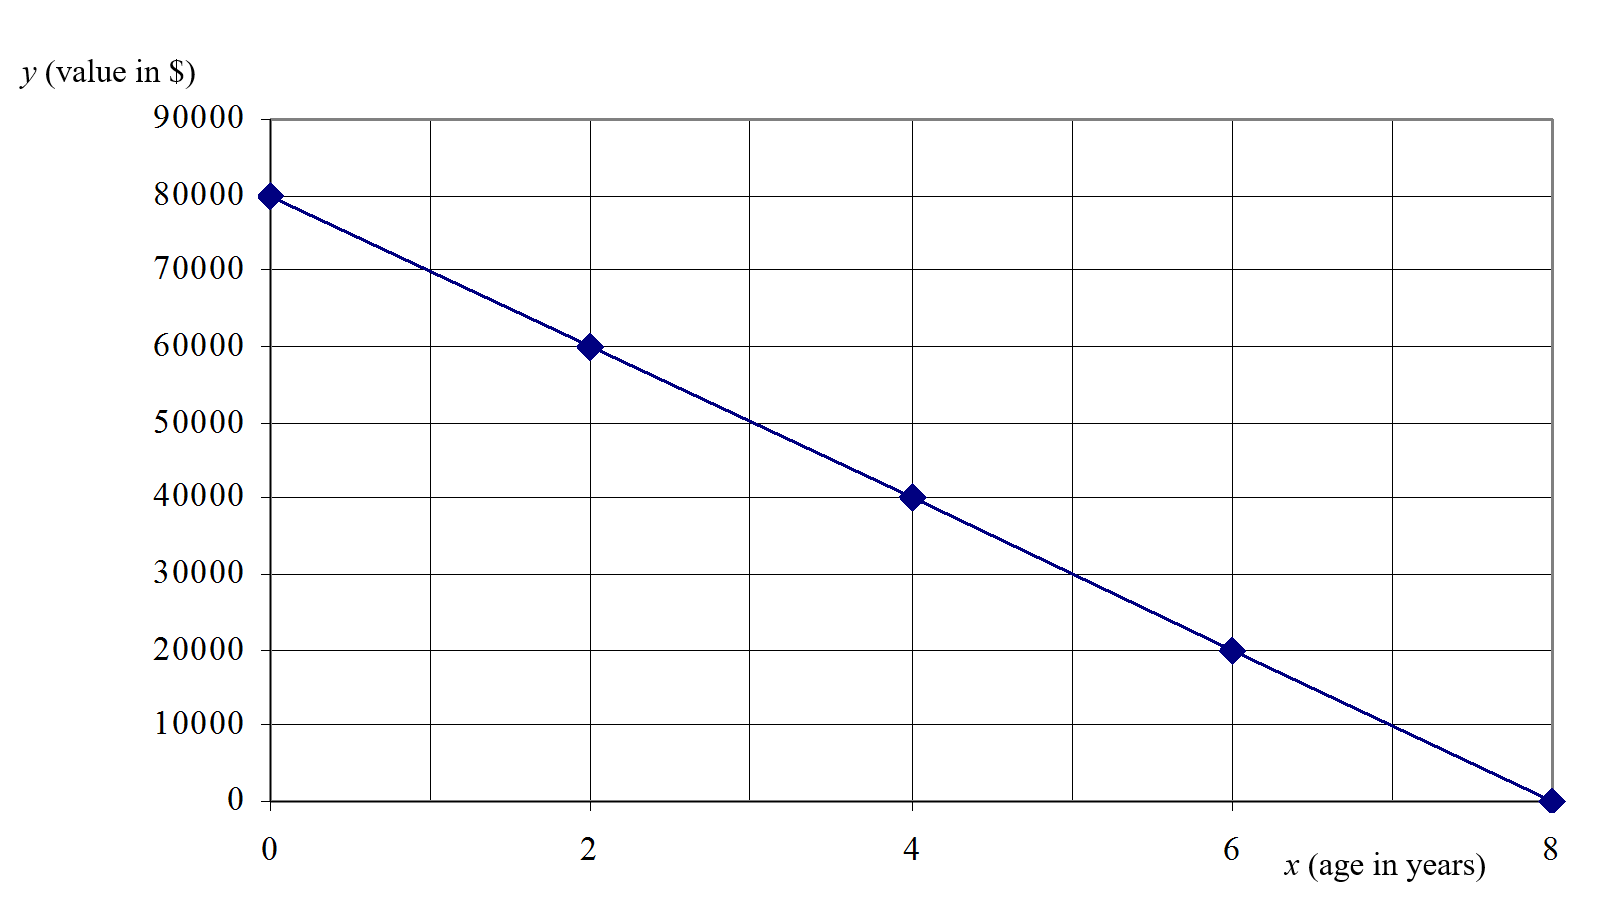
From the graph we see that the model shows that the car would have a value of zero after 8 years.
This is almost certainly wrong. The model further shows that after 8 years the value would become negative, which would certainly not be true. We would not expect a linear model to be appropriate for all values of time
in this situation.
Linear models are the simplest models, which can be too simplistic for some situations.
Often a model may not represent real life scenarios. However, it can still be useful to us even if it is not perfect. Using a model can be better than just guessing what will happen.
Even if the situation cannot be modeled with a linear equation for all values of the variables, the model might be very good for some of the values.
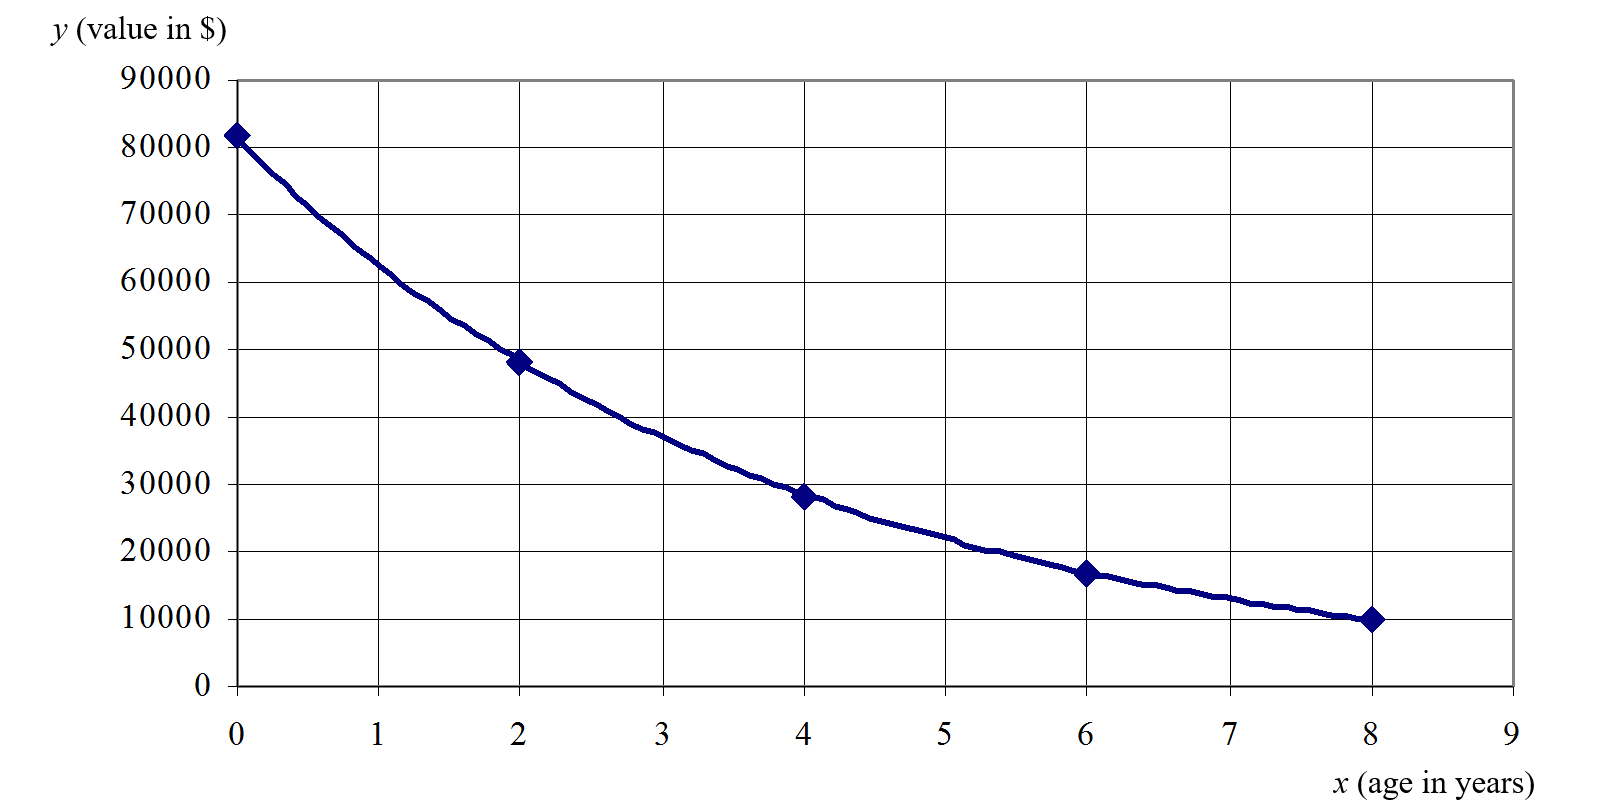
Part of the relationship might be linear, or approximately linear, and part might be non-linear. The mathematical form of the model displayed here would be more complicated than a linear equation.
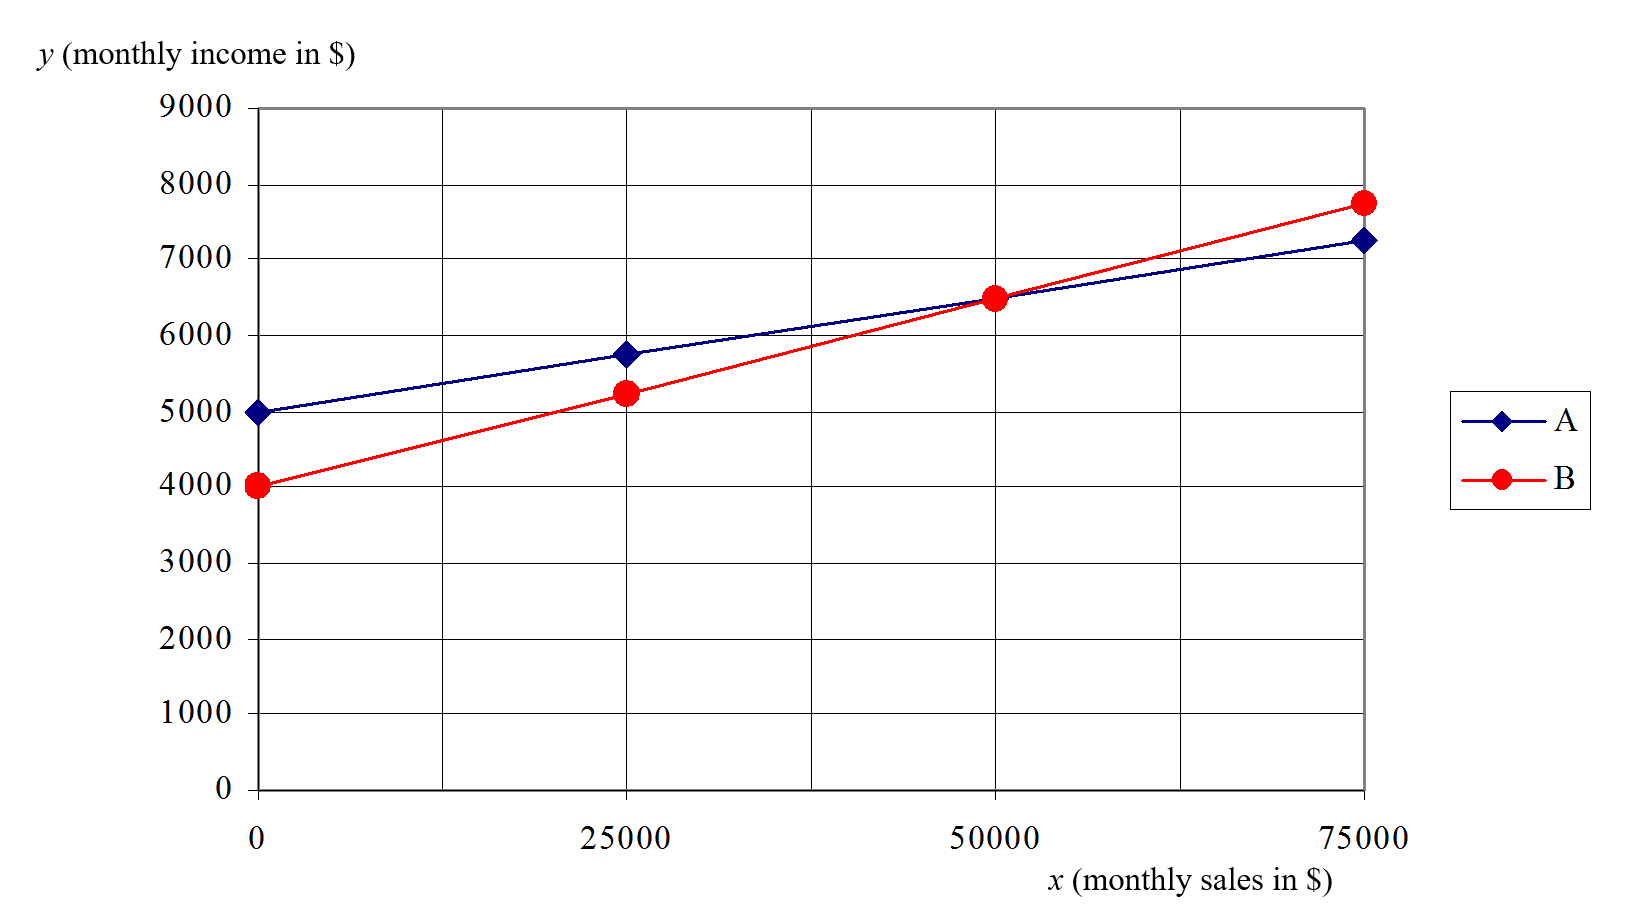
Exercise 3: Two salespeople work for the same company. Their monthly incomes are calculated as follows.Salesperson A: y = 0.03x + 5000; Salesperson B: y = 0.05x + 4000
where, in each case x is the monthly sales, in dirhams and y is the monthly income, in dollars.
Question: Draw an accurate graph of these equations for x = 0 to x = 80000 on the same diagram using the horizontal axis for x and the vertical axis for y.
Solution:Tables for graphing the equations are as follows:
| x | 0 | 4000 | 80000> |
| y | 5000> | 6200 | 7400> |
| x | 0 | 2 | 4 | 6 | 8 |
| y | 80000 | 60000 | 40000 | 20000 | 0 |